Field Observations: Real-Time Data from the January 13 Storm & Flooding in Boston

Contributors: Kirk Bosma, Joe Christo, Chris Gloninger, Katie Lavallee, & David Weaver (Photos)

For the second time in less than one week, Boston experienced a significant storm event that caused flooding throughout the city on January 13, 2024. During this event, the late morning high tide was the fourth highest water level ever recorded at the Boston NOAA tide gauge.

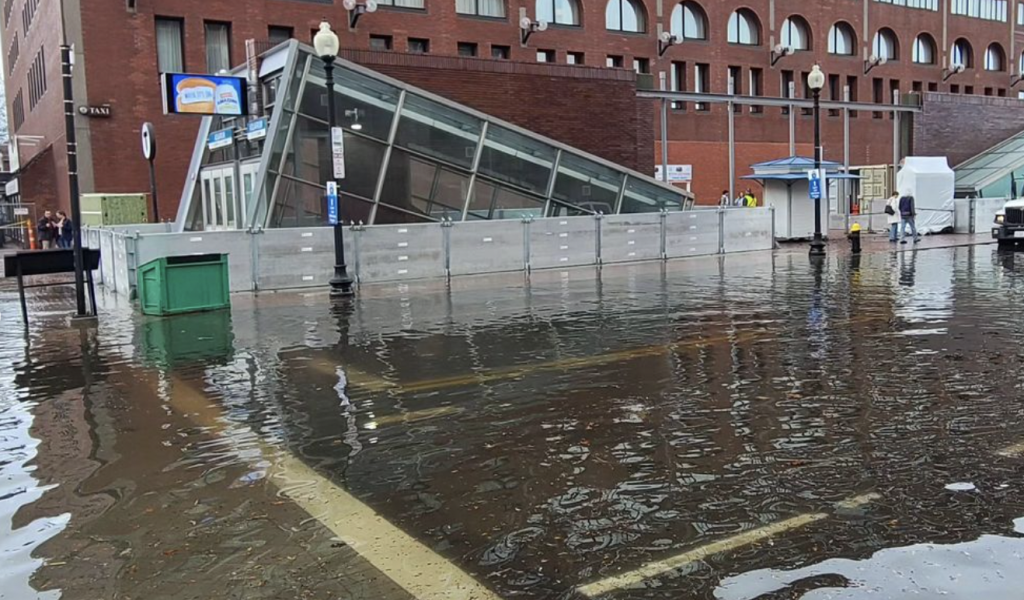
Flood barriers are deployed at Aquarium Station on the Blue Line on January 13, 2024 (Photo by David Weaver)

Similar to the recent storm on January 10, 2024, the flooding at Long Wharf in Downtown Boston, East Pier Drive in East Boston, and other locations was captured on video by journalists and residents and shared on the news and social media.

Meanwhile, our team at the Stone Living Lab was again gathering data via instrumentation that we have deployed as part of our Real-Time Monitoring in Boston Harbor project, launched this fall in collaboration with Woods Hole Group and the City of Boston. Collecting high-quality, continuous metocean time series data helps the Lab and municipal partners like the City of Boston evaluate normal, changing climate, and storm conditions in Boston Harbor, which helps inform adaptation and resilience planning.

Please see below for a short summary of data readings and observations.

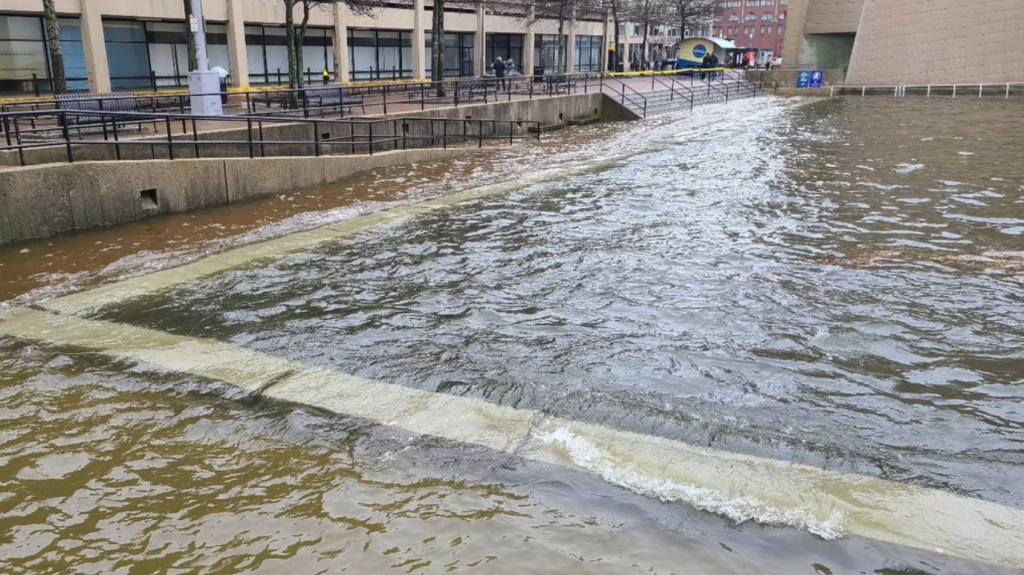
A flooded Harborwalk between India Wharf & Central Wharf on January 13, 2024 (Photo by David Weaver)

Context

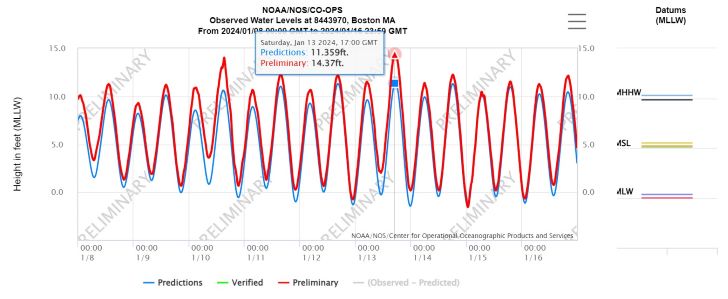
At the Boston NOAA Tide Gauge, high tide peaked at 11:48 am at 14.41 feet Mean Lower Low Water (MLLW), which was over 3 feet higher and half an hour earlier than the predicted high tide level.

Data from the Stone Living Lab Hohonu Overland Flooding Sensors

This surge referenced above was also observed at our Hohonu overland flood stations throughout Boston (all in inundation depth, in feet above the ground surface).

  • Long Wharf, Downtown Boston: 2.6 feet of flooding at 12:24pm, with inundation lasting approximately three hours, from 11:00am – 2:00pm.
  • Border Street, East Boston: 2.2 feet of flooding at 11:54am, with inundation lasting approximately three hours, from 10:45am – 1:45pm.
  • Tenean Beach, Dorchester: 3.4 feet at 12:12 pm, with inundation lasting approximately four hours, from 10 am – 2 pm. Flooding was observed at each high tide from January 10 to January 14.
  • Morrissey Boulevard, Dorchester: 0.8 feet of flooding at 12:12 pm, with inundation lasting two hours, from 11:00am – 1:00pm.

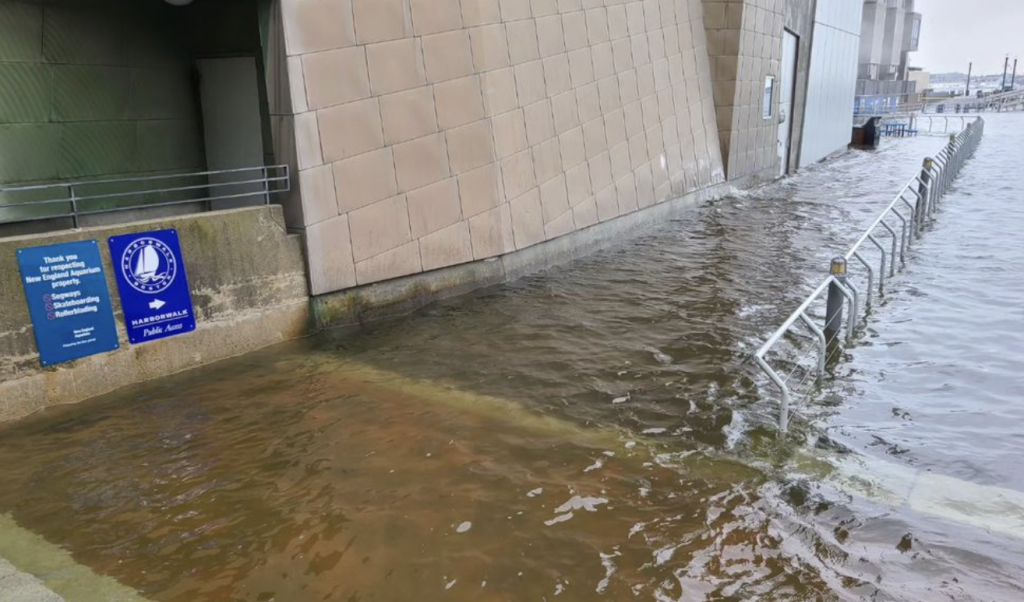
    Flooding outside of the New England Aquarium on Central Wharf in Downtown Boston (Photo by David Weaver)

Data from the Stone Living Lab Rainsford Island Meteorological Station

Our Rainsford Island station recorded sustained wind speeds reaching 28 MPH, with gusts up to 38 MPH peaking on January 13 at 6am.

Data from the Stone Living Lab Gallops Island Tide Gauge

Our Gallops Island tide gauge recorded flood tide elevation of 8.5 feet NAVD88 at 12 pm on January 13. This was approximately 0.8 feet higher than the high tide recorded on January 10.

Observations
  • The late morning high tide on January 13 was the fourth highest water level ever recorded at the Boston NOAA Tide Gauge. Five of the top 10 highest water levels have occurred since 2018.
  • The Portland, Maine NOAA tide gauge recorded its highest water level ever. That tide gauge has a shorter historic record than the one in Boston Harbor, but this storm had a higher water level than the Blizzard of ‘78.
  • These were amongst the highest levels of flooding ever scientifically observed at Long Wharf, Border Street, and Tenean Beach.
  • This system was very similar to the one that occurred on January 10, however the surge wasn’t drawn out quite as long as the January 10 system as winds quickly diminished, thus shortening the surge window.
  • This Atmospheric River was not as strong as the one on January 10, but that doesn’t mean it wasn’t impactful.
  • While winds weren’t as strong as they were on January 10, the significant fetch and a higher astronomical tide assisted in raising water levels higher than the ones seen on January 10.
  • The storms on January 10 and January 13 had many similarities
  • Without snow cover, more mixing can occur – less chance of an inversion. Snow/surface cold often prevents SE winds from mixing to the surface.
  • One of the most powerful east coast Atmospheric Rivers (AR) on record. Atmospheric Rivers make storms stronger via latent heat release.
  • Strength of the AR is based on the low-level jet (LLJ) or winds at 925mb.
  • Potential fetch is geographically larger than what you would expect with a tropical cyclone (TC). The storm surge magnitude associated with a TC is often greater than storms associated with an AR, but the geographical area and duration of surge may be greater with a storm associated with an AR than a TC.
  • Surge onset was before low tide early AM HT, very little receding water at low tide, which exacerbated high tide flooding early afternoon. Many areas were inundated for hours.

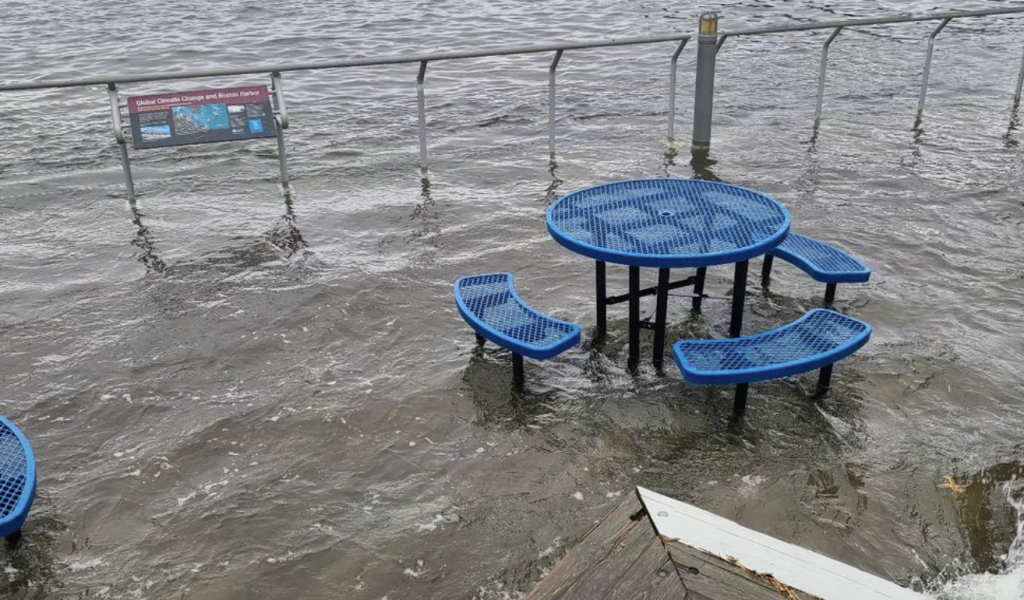
    Flooding at a picnic area outside the New England Aquarium on Central Wharf in Downtown Boston (Photo by David Weaver)

About the Real-Time Monitoring in Boston Harbor project

This project – launched in the fall of 2023 in partnership with Woods Hole Group and the City of Boston – provides real-time monitoring of waves, water level, and meteorological parameters in and along Boston Harbor. The project is the next phase of work that the Lab has conducted since 2021, and provides a continuous time series of metocean data to evaluate normal conditions, changing climate, and storm conditions in Boston Harbor. All systems are real-time, and as such, will provide preliminary data to the web that can be viewed by the public as well as our researchers.