Field Observations: Real-Time Data from the October 12-14th Nor’easter
Our multi-day Nor’easter has finally pulled away. While it wasn’t a particularly strong storm, it lingered for nearly 72 hours. The setup behind it is known as an Omega block, named after the Greek letter it resembles. Think of it like putting a kink in a garden hose: once the flow is disrupted, everything slows down. That’s what’s been happening in the upper atmosphere, causing the storm to stall in place.
There were two areas of low pressure associated with this storm – one off the coast of South Carolina and another east of New Jersey. The pressure difference between these systems helped drive the winds, as air naturally flows from areas of higher pressure to lower pressure. The tighter the pressure gradient, the stronger the winds. Strong high pressure over northern Maine helped to increase the wind speeds. The graph below shows frequent wind gusts at the Stone Living Lab Rainsford Island Meteorological Station reaching and exceeding 30mph from the morning of October 12th through to the morning of October 14th.
Persistent gusty winds, over multiple high tide cycles also produced minor coastal flooding during times of high tide. The Stone Living Lab overland flooding sensor at Tenean Beach recorded flood depths between a half foot and foot with splash over reported from visual observations at Boston’s Long Wharf.
The region lucked out, once again, the higher water levels associated with the King Tides occurred late last week. Had the storm occurred during the King Tides, many coastal communities would have experienced moderate levels of coastal flooding.
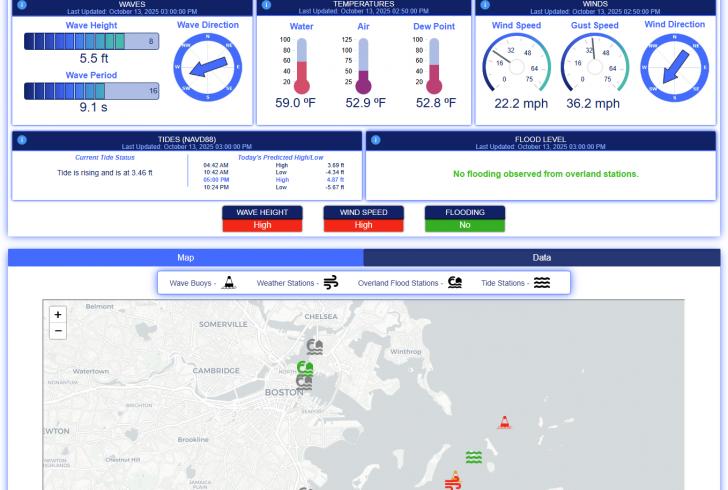
Our team at the Stone Living Lab was busy gathering and analyzing data via instrumentation we’ve deployed as part of our Climate Change Observatory, in collaboration with Woods Hole Group and the City of Boston. Collecting high-quality, continuous metocean time series data helps the Lab and municipal partners like the City of Boston evaluate normal, changing climate, and storm conditions in Boston Harbor, which helps inform adaptation and resilience planning. Stone Living Lab’s Real-Time Dashboard displays live data accessible to the public.
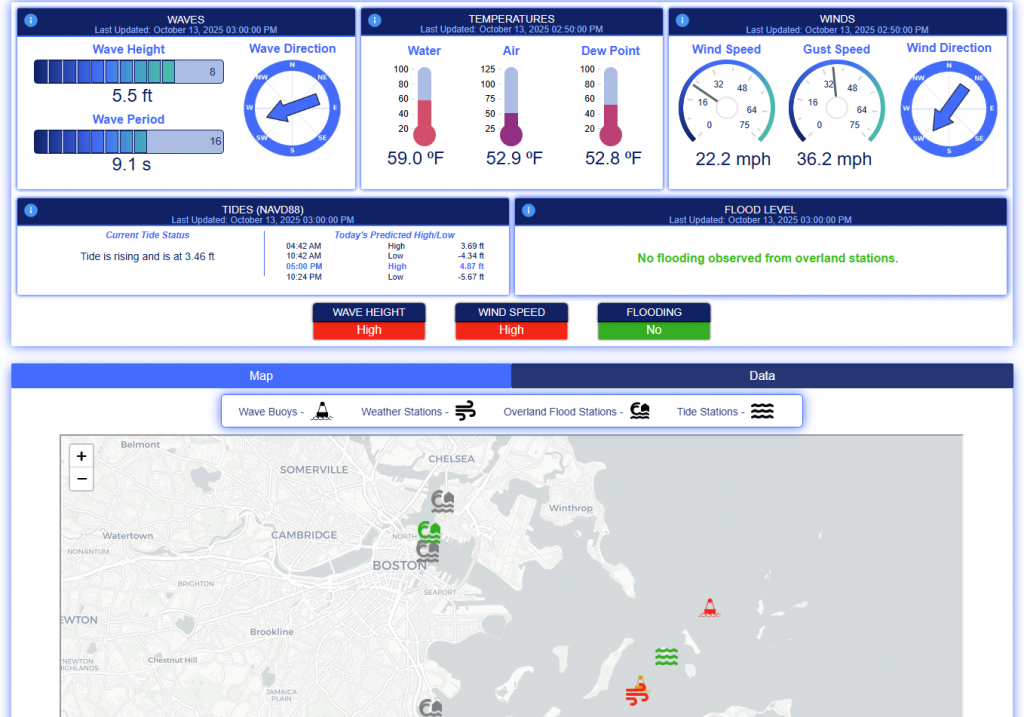
Here the SLL Real-Time Monitoring Dashboard displays live data during the storm. This screen capture was from Oct. 13 at 3:18pm
Please see below for a short summary of data readings and observations.
Tenean Beach, Dorchester: flooding observed through the spring tide event and through the Nor’easter (6 total overland flooding events from Oct. 7 – Oct 13). Peak flood depth of 1.05 ft before the storm, during the highest high tide on Oct. 8th 12:36pm. 0.87 ft of flooding at 4pm on Oct. 12th, lasting about 4 hours (3:10pm to 6:58pm). 0.67 ft of flooding at 5:18pm on Oct. 13th, lasting about 3 hours 40 mins (4:18pm to 7:56pm)
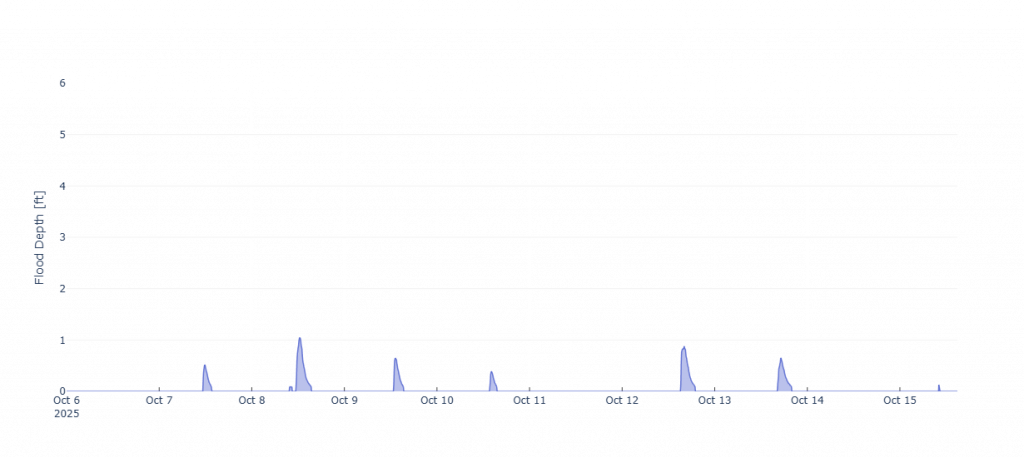
Overland flooding detected at Tenean Beach between Oct 5-15
Lewis Mall, East Boston: No flooding recorded at the station location.
Our other sensors were offline during the event.
Data from the Stone Living Lab Rainsford Island Meteorological Station
Our Rainsford Island meteorological station recorded the following wind speed data:
Wind speed was elevated between 5:00am Oct. 12th and 8:00am October Oct. 14th with gusts ranging between 25 and 41 mph during that period.
Highest recorded wind speeds of 30 mph, with 41 mph gusts on Oct. 12th at 8:25pm.
Winds consistently came from the northeastern.
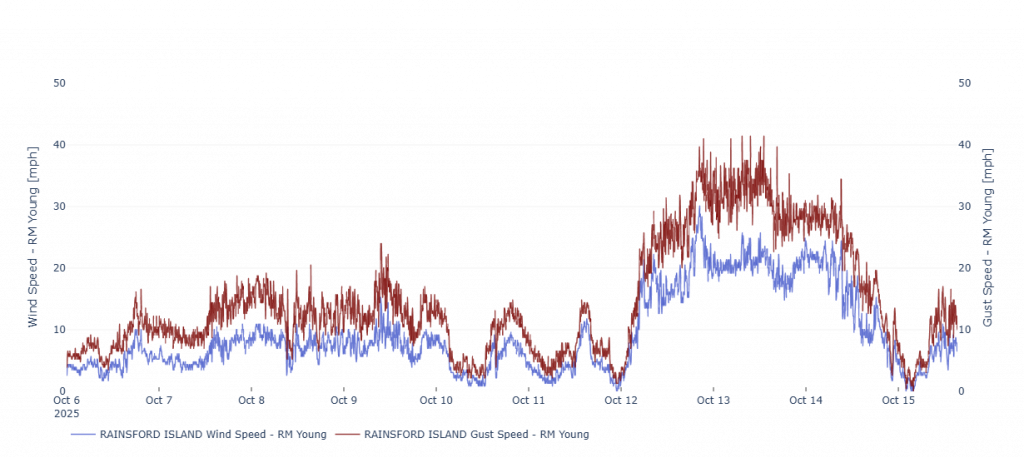
Windspeed measured by the SLL Rainsford Island Meteorological Station between Oct. 6-15
The spring high tide peaked at 6.13 ft NAVD88 on Oct. 8 at 12:18pm.
Storm surge could be seen in elevated low tides between Oct. 12-15.
Peak storm high tide of 5.97 ft NAVD88 on Oct. 12 at 4:00pm. This high tide at the Boston NOAA tide station, was a measured 6.22 ft NAVD88, with a predicted high tide of 5.37 ft NAVD88, and a forecast guidance flood estimate of 6.85. Indicating that the high tides during the storm exceeded the prediction under normal conditions, but observed water levels were not as high as predicted with the storm forecast.
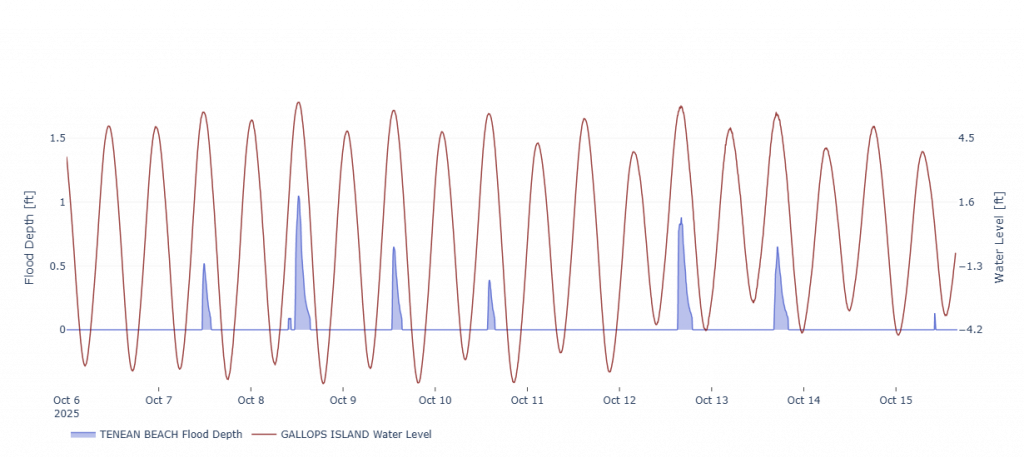
Tide height measured by SLL Gallops Island tide station overlaid with overland flooding measured at Tenean Beach between Oct. 6-15.
Significant wave heights above 3 ft were observed from Oct. 12 at 6:00pm – Oct. 14 at 7:40pm, waves consistently coming from the northeast.
The largest (maximum height) waves observed were 10.2 ft at 5:20am on Oct. 13 (correspond to significant wave heights of 6.5 ft at 8.8 seconds).
Significant wave heights above 2 ft were observed from Oct. 12 at 4:00pm – Oct. 13 at 8:00pm, consistently from east-northeast.
Largest waves observed were 2.7 ft at 4 seconds on Oct. 13 at 7:00am.
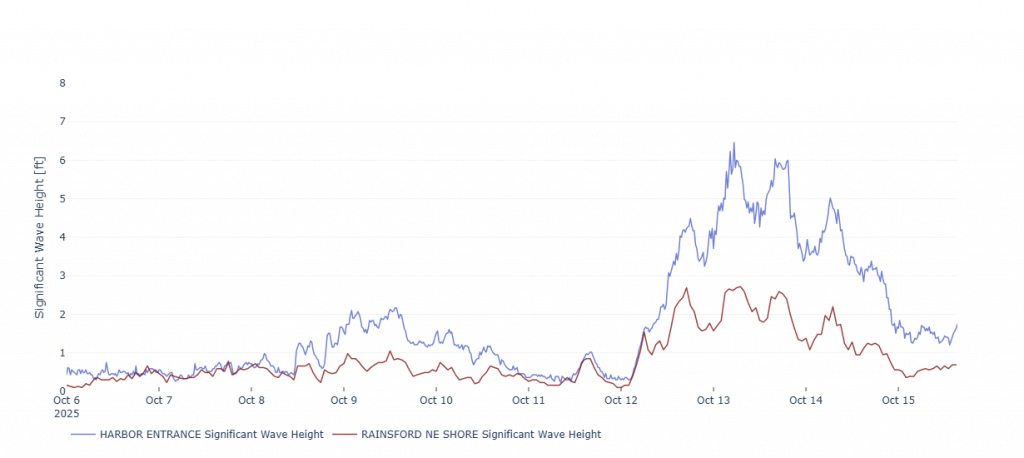
Significant wave height measured by SLL Harbor Entrance buoy (blue) and Rainsford NE Shore buoy (red) between Oct. 6-15.