Intense Intertidal Temperatures
by Annie O’Connell
Community Science Coordinator
Fall is officially right around the corner, ushering in very welcome crisp autumn weather. The 2022 summer season debuted record-breaking temperatures across the world, and Boston was no exception. With several heat waves lasting for days, residents struggled to stay cool as city officials declared two heat emergencies. As climate change sets in, the unfortunate reality is that we can expect longer periods of more intense heat in our region during the summer months.
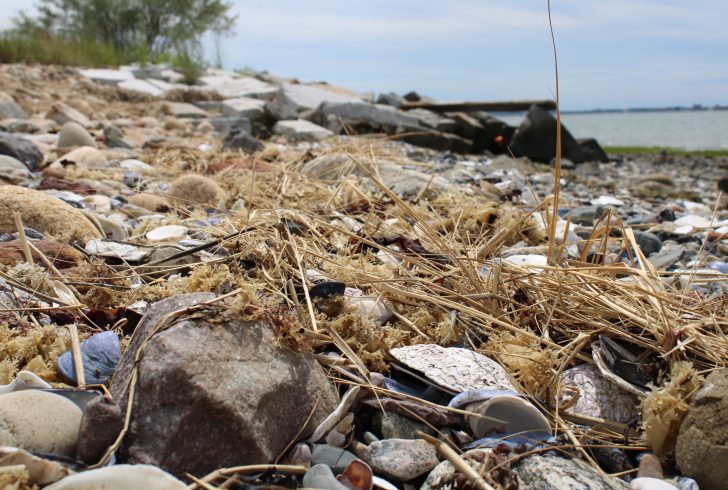
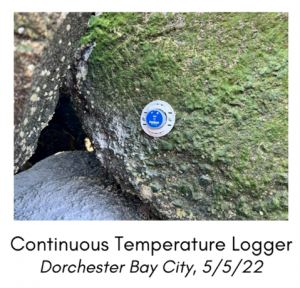
We all know it was hot in the city – but how hot was it along our coasts? As part of this year’s community science project, temperature loggers were installed at nine different sites around greater Boston in the intertidal zone. The intertidal zone is the area along a coast that is underwater at high tide, and exposed to air during low tide. Our loggers monitor temperature continuously every 15 minutes and provide a detailed look at how temperatures fluctuate in this zone. They are attached to boulders that are exposed during low tide but submerged during high tide, the same kinds of conditions intertidal species live through every day. Our volunteers download the data from the loggers using an app and submit it to researchers for a closer look.
From July 19th – July 26th, Boston experienced a memorable weeklong heatwave with air temperatures well over 90°F every day, even topping out at 100°F on July 24th. We typically think of the coast as a place to cool down, but our sensors revealed that our intertidal sites were experiencing extreme heat, too. The highest temperatures recorded during this heat wave at our sites were on July 19th, 20th, and 21st. These high temperatures coincided with low tide near mid-day – when the sun’s heat is the most intense. The highest temperature overall was at Savin Hill Cove in Dorchester, which was over 120 °F on July 20th, when an 11:25 AM low tide exposed the area to harsh sun. Other low tides later on in the heat wave exposed less of the intertidal zone and fell later in the afternoon, keeping conditions slightly cooler. At the Savin Hill Cove site, this meant the difference between a high surface temperature of 100°F on July 18th and 85°F on July 26th, even though air temperatures both days reached the low 80s.
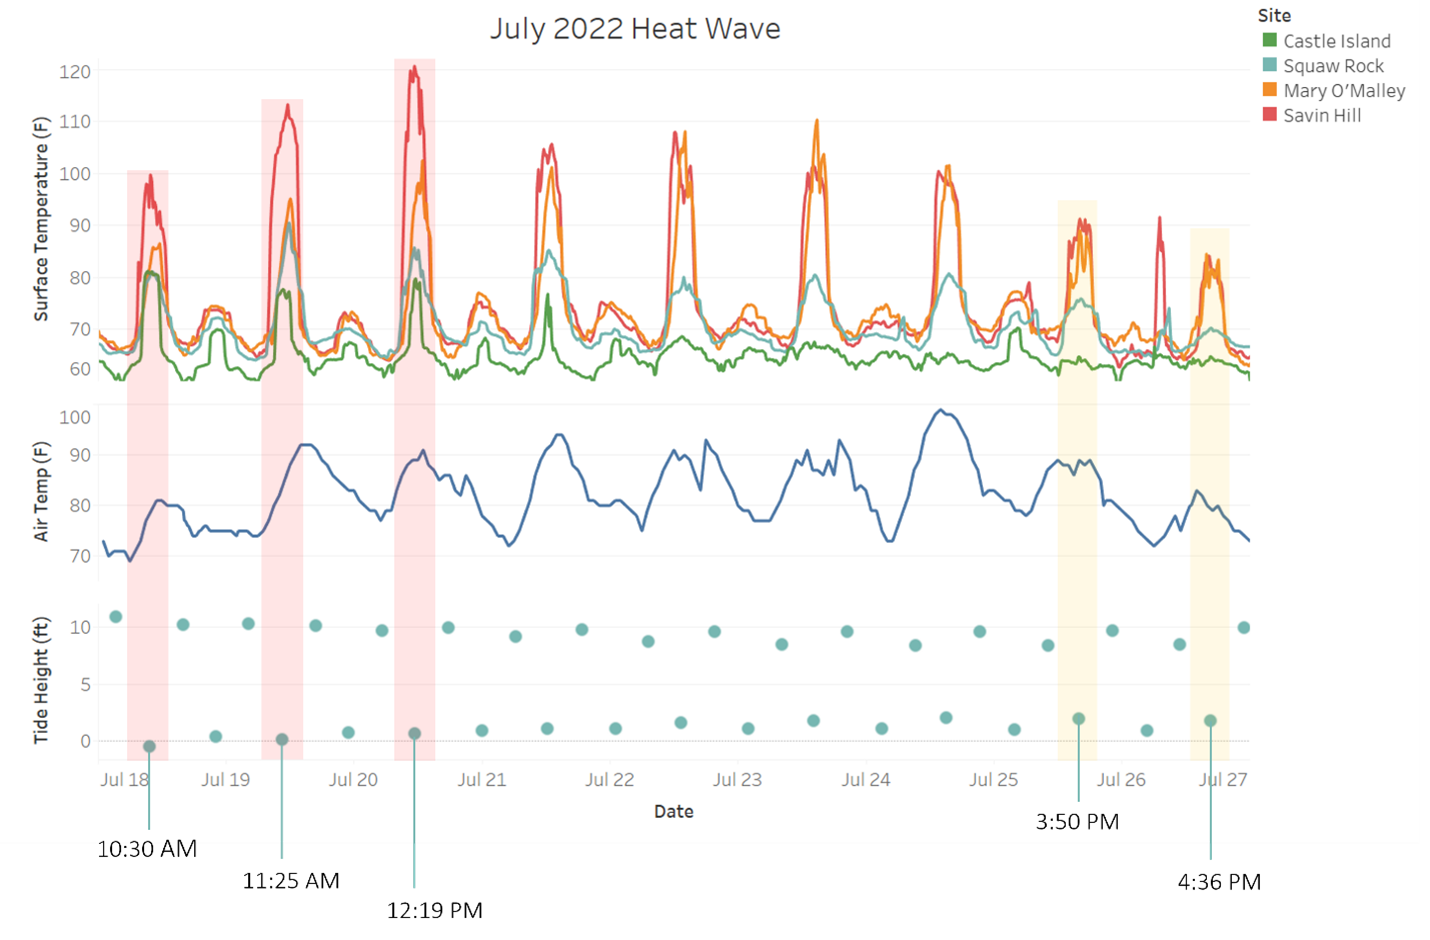
Daily surface temperatures at the intertidal always peak when the area is exposed to warm air temperatures, but local environmental factors decide how intense the heating effect will be. Savin Hill Cove experienced surface temperatures of over 120°F on July 20 and surface temperatures at Mary O’Malley Park topped out at about 100°F that same day, while Squaw Rock and Castle Island surface temperatures actually remained cooler than the air temperature. What accounts for the 40-degree difference?
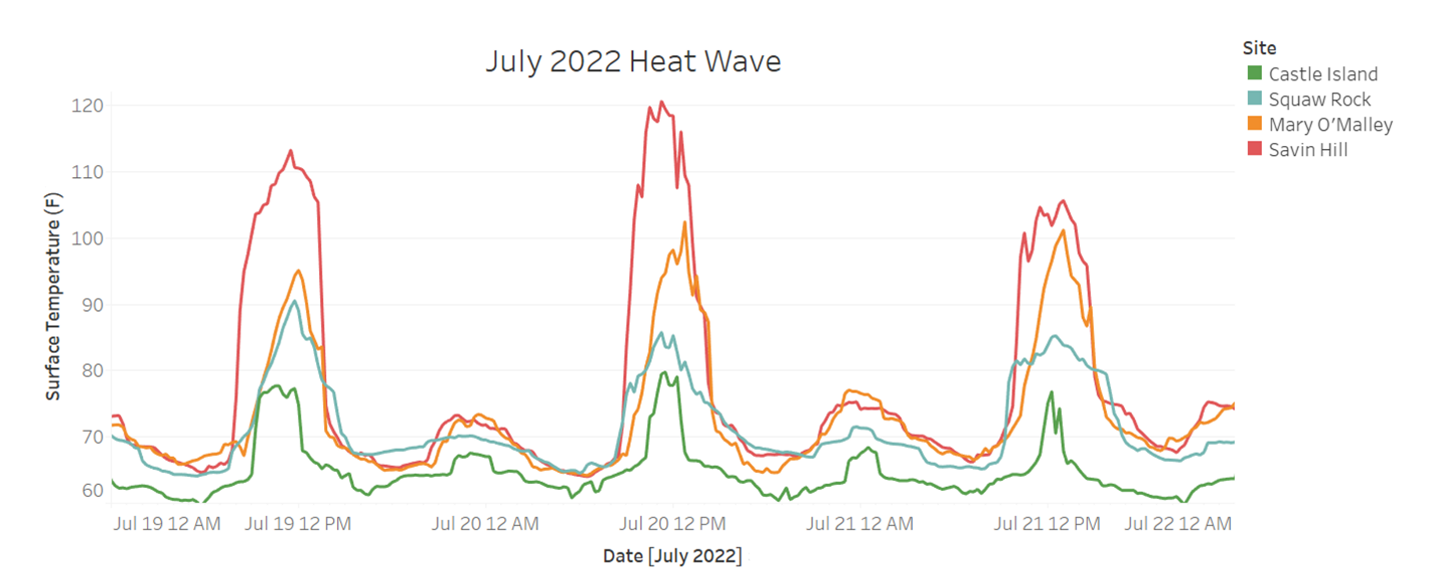
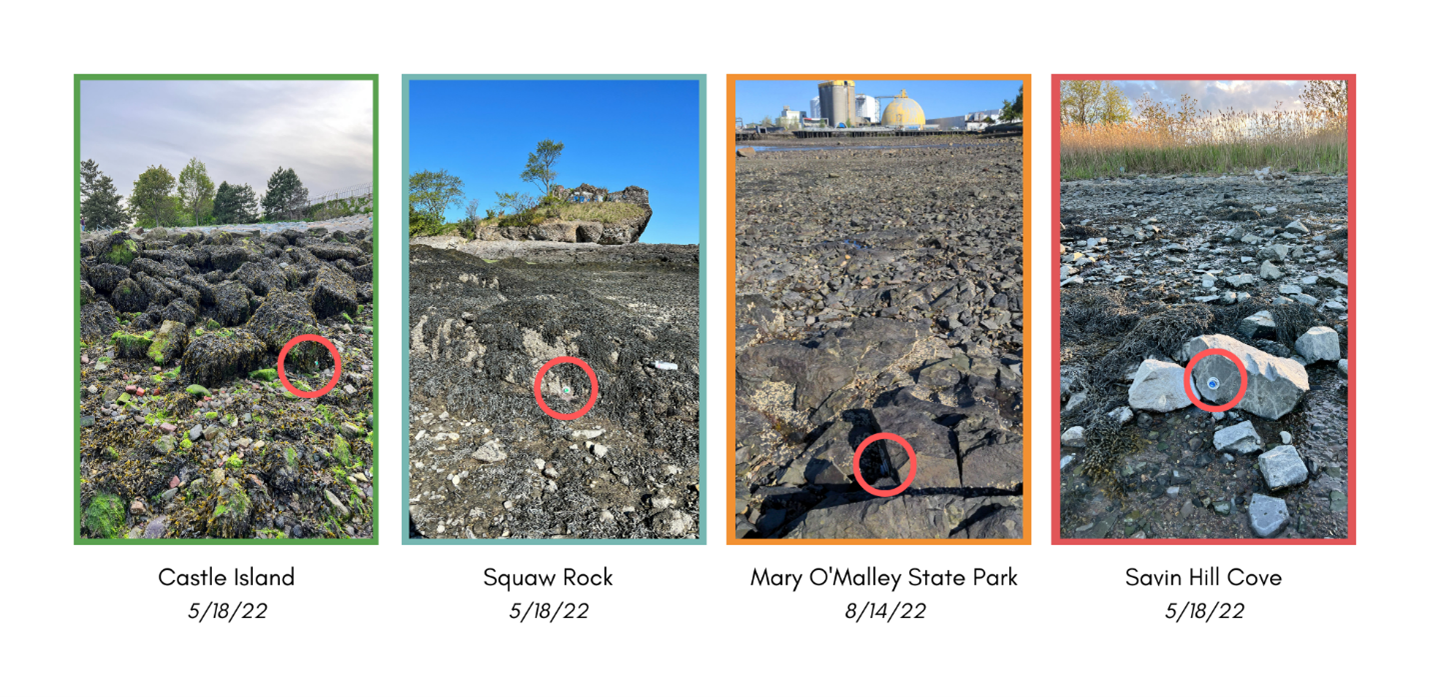
One major factor is surface cover. All of the sites chosen for this study are intertidal areas, but they each have different local environmental conditions. Some sites like Castle Island and Quincy’s Squaw Rock have a generous covering of seaweed that helps temper the intense sun and air temperatures during a heat wave. Mary O’Malley Park and Savin Hill Cove, on the other hand, are more barren and rocky. Just like asphalt absorbs the sun’s heat and becomes much hotter than air temperatures on a summer day, darker rocks in the intertidal zone with little cover from seaweed will warm up quickly. If you were a periwinkle living in Savin Hill Cove this summer, you would have had to withstand temperature swings of up to 55°F a day to survive.
We were shocked to discover the incredible temperature swings experienced by Boston’s intertidal habitats this summer. Our volunteers will continue collecting data every month through December, including information about the numbers and kinds of organisms living in the intertidal zone. We will use this data to investigate how this summer’s heat waves might have impacted our local intertidal communities. You can explore the data yourself here, and stay tuned for more updates this fall and winter!
Weather Data: Weather Underground
Tide Data: US Harbors