Contributors: Colin Evans, Katie Lavallee, Alexis McLean, Liana Greenberg-Nielsen
Overview
An intense blizzard was generated by a coastal cyclone between the late afternoon and evening hours of Sunday, February 22 into Monday, February 23.
Peak storm conditions occurred during the late morning to mid-afternoon hours on February 23. The combination of snow accumulation, high winds, and temperature drops made for very hazardous conditions causing power outages and travel bans throughout southeastern Massachusetts and along the coast.
Data from Stone Living Lab Tenean Beach Hohonu Overland Flood Sensor
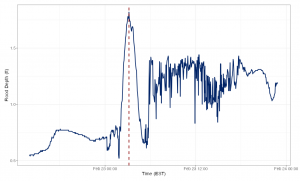
Flooding captured by the Tenean Beach Hohonu (blue). 0.6ft of snow build up can be seen on the graph. The red line indicates high tide at 3am.
The Stone Living Lab’s Tenean Beach Hohonu Overland Flood Sensor recorded 1.2 ft of overland flooding with inundation lasting just under 3 hours around the 3 am high tide. The 3 am high tide recorded at the Boston NOAA station was 12.54 ft MLLW, 2 feet higher than predicted.
Data from Stone Living Lab Rainsford Island Meteorological Station

Gust speed (blue), wind speed (green), and wind direction (indicated by cardinal direction arrows) measured at the Stone Living Lab Rainsford Island Meteorological Station.
The Rainsford Island Meteorological Station recorded maximum wind speeds of 45 mph, with gusts reaching 56 mph between 7 am to 10 am on Monday, February 23. Winds began to drop around 11 am and showed a slow but gradual decrease in magnitude during the afternoon into evening hours, leveling out between 10-15 mph entering into Tuesday, February 24.
Winds mainly came from the northeast in the late hours of Sunday, February 22. Wind direction shifted, coming from the north at 4 am on February 23. Winds were mainly from the north during peak storm conditions and shifted north-northwest by mid-afternoon.
Data from Stone Living Lab Gallops Island Tide Station

Water level (ft NAV88) as measured by the Gallops Island Tide gauge.
Peak water level reached 6.56 ft NAVD88 just after 4 pm on February 23 and a secondary peak of 6.11 ft NAVD88 at 4:15 pm that same afternoon.
Data from Stone Living Lab Harbor Entrance Wave Buoy
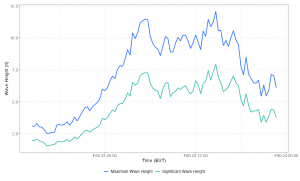
Wave height (blue) and significant wave height (green) measured by the Harbor Entrance Wave Buoy.
Waves started building overnight and into the early morning hours of February 23. Peak wave heights occurred at 5:20 am and 2:40 pm, with maximum wave heights reaching 11.5 ft and 12.1 ft, respectively, on February 23.