All Storms are Local: The December 23rd 2022 Storm in Boston Harbor
This past winter, a Nor’easter (or extratropical storm) landed in Boston Harbor on December 23. This was part of a massive storm that affected the United States from the Midwest to the east coast and parts of Canada , disrupting trains, flights, and leaving over 1.5 million people without power. How does this kind of storm affect Boston Harbor? Our monitoring equipment is answering that question!
NOAA currently has a floating buoy (#44013) in Massachusetts Bay, reporting regular data about wind and wave action. The Boston Buoy is offshore of Boston Harbor where the water is about 200 feet deep . In 2021 Stone Living Lab researchers installed a similar buoy just north of Rainsford Island, in about 25 feet of water. The Lab also has a meteorological station on Rainsford Island that collects regular weather data (see the live data here).
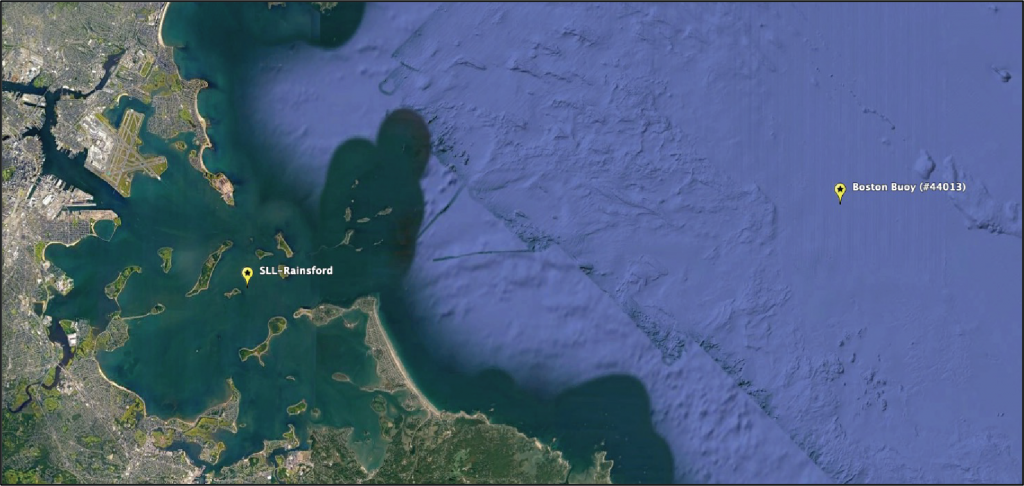
NOAA’s Boston buoy (right) in Massachusetts Bay, while the Lab Rainsford buoy (left) is within Boston Harbor.
By comparing the data from two buoys during the same storm, the Lab is painting a picture of how Nor’easters truly impact Boston Harbor. The wave data from the Rainsford observatory tells a slightly different story than that of the Boston Buoy. One of the ways we can visualize wind or wave data is with a compass or wave rose. These roses show us the direction and strength of winds or waves at any given time. When we compare the wave roses from the NOAA buoy to the SLL buoy, we see some surprising differences.
On December 23, 2022, the wave rose from the Boston Buoy shows a typical Nor’easter. The waves in this case are not coming from the northeast, but rather from the east and east-southeast (Figure 2 below). This is not uncommon for a winter storm in the area. However, waves at the Rainsford Buoy show the same pattern as the Boston Buoy, strong east, east-southeast waves , and also showed waves coming from almost every direction. If we think about the environment of the Harbor versus the open ocean of Massachusetts Bay, these differences make sense: the Harbor is shallower than the open ocean, and waves and tides are bouncing off of and between the 34 islands and peninsulas.
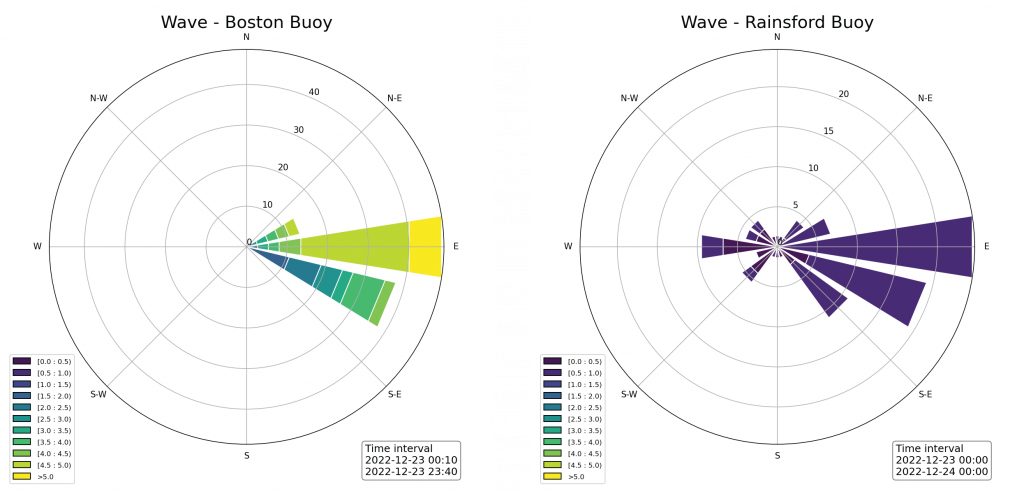
Figure 2. On the left compass rose, NOAA’s buoy showed large waves coming from the south/southeast. On the right, the wave rose from the Rainsford buoy reported smaller waves from many directions.
When we compare the wave heights recorded at the NOAA buoy versus the Lab buoy, we can also see the incredible storm protection the island provide to Boston Harbor. During the month of December, waves in Massachusetts Bay ranged from half a meter (1.5 feet) to nearly 6 meters (20 feet) during the storm. Compare that to the wave heights we saw in Boston Harbor: they never went above one meter (three feet). Again, this kind of hard data directly supports the lived experiences of people living in and around Boston Harbor.
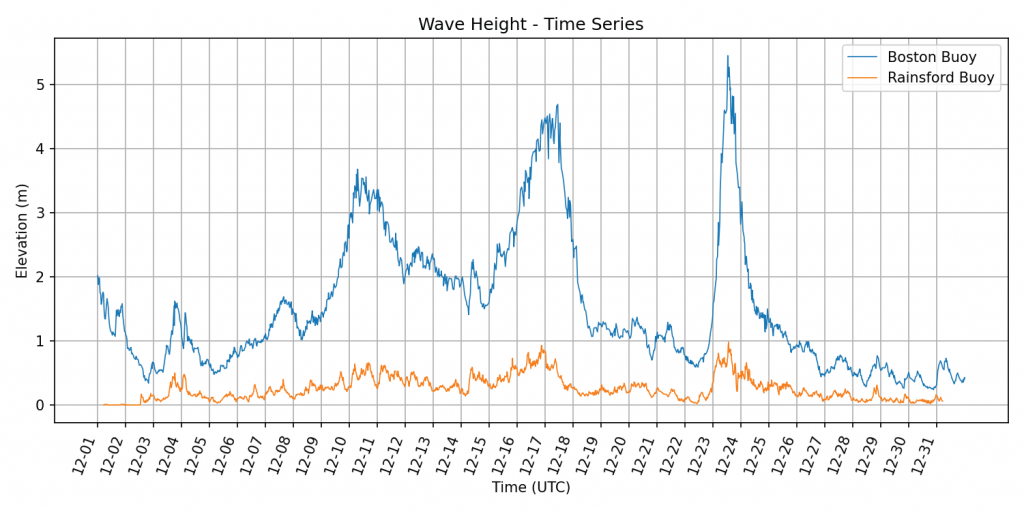
Graph showing wave heights measured during the month of December from the NOAA buoy (top blue line) and Rainsford buoy (orange bottom line).
Using this type of data collection and analysis scientists are getting a rare, real-time picture of how storms impact very specific areas of Boston Harbor, the islands, and the coast. This kind of crucial information will help guide future research and decisions about how communities can best prepare for and adapt to storms. As climate change makes these kinds of storms stronger, more frequent, or even just more unpredictable, these wave buoys will play a critical role in shaping adaptation strategies. As we enter the quieter warmer months of spring and summer, Lab researchers will continue analyzing data and prepping equipment for next year’s winter storms!