Explore Live Data
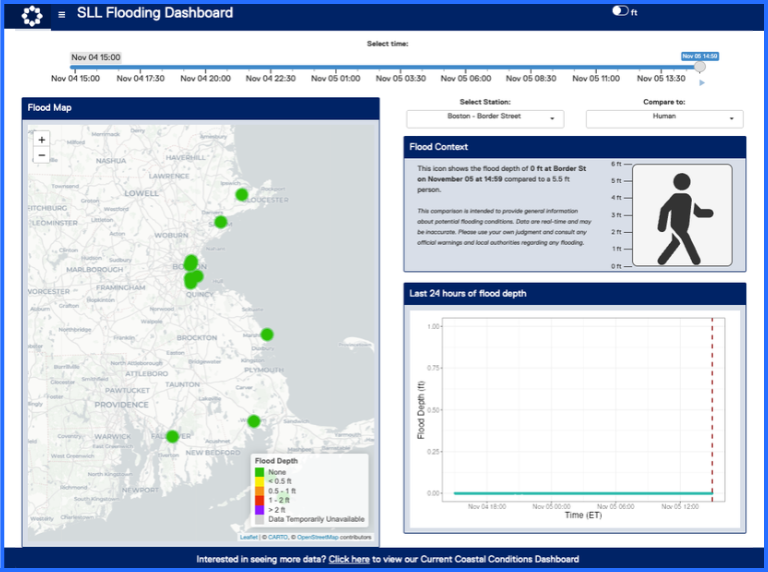
Flooding Dashboard
View real-time data from our overland flood sensors across coastal Massachusetts. In this dashboard, you can find out whether it’s flooding at various sensor locations and what different flood levels might look like.
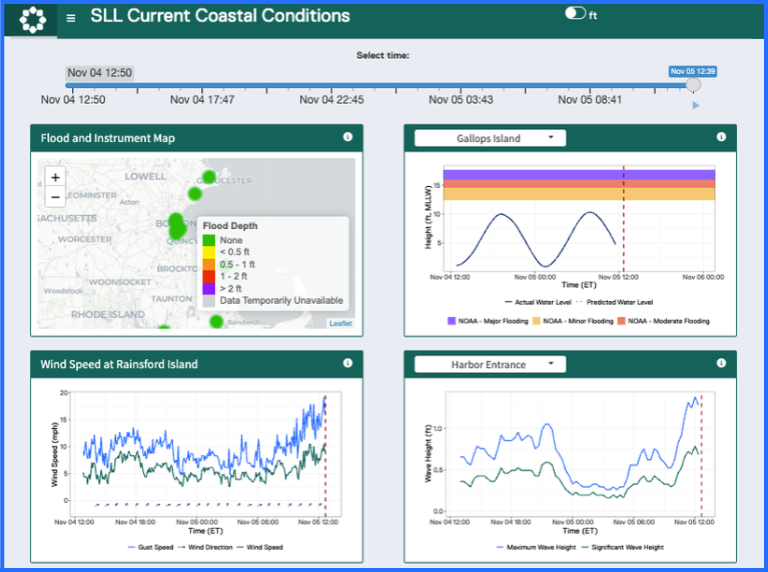
Current Coastal Conditions Dashboard
Our Current Coastal Conditions Dashboard allows you to explore live data from monitoring equipment across Boston Harbor and coastal Massachusetts. This dashboard provides data on wind speed, wave height, and water levels in addition to flooding.
Download Data
Tide Gauge Gallops Island
Water level data measured at Gallops Island. Data are measured in feet NAVD88 and are reported every 6 minutes. Monthly datasets currently available from June 2025 to present.
Wave Buoy Rainsford Island
Wave conditions measured on the north east side of Rainsford Island. Data include significant wave height, wave period, and direction reported every hour. Monthly datasets currently available from May 2026 to present.
Note: the Rainsford Island Buoy is currently experiencing equipment issues and is sporadically recording data.
Wave Buoy Boston Harbor Entrance
Wave and weather conditions measured in Boston Harbor. Data include significant wave height, maximum wave height, wave period, wave direction, air temperature, wind speed, and wind direction reported every 20 minutes. Monthly datasets available from May 2026 to present.
Wave Buoy North Shore
Wave and weather conditions measured in Ipswich Bay. Data include significant wave height, maximum wave height, wave period, wave direction, air temperature, wind speed, and wind direction reported every 20 minutes. Monthly datasets available from May 2026 to present.
Weather Station Rainsford Island
Weather conditions measured on Rainsford Island. Data include air temperature, air pressure, wind speed, and wind direction reported every 20 minutes. Monthly datasets available from November 2025 to present.