Field Observations: Real-Time Data from the February 13 Storm & Flooding in Boston
Boston experienced another significant storm event that caused flooding in several neighborhoods throughout the city on Tuesday, February 13, 2024.
Similar to the January 10 & January 13 storms, the flooding at Long Wharf in Downtown Boston, East Pier Drive in East Boston, and other locations was captured on video by journalists and residents and shared on the news and social media.
Meanwhile, our team at the Stone Living Lab was again gathering data via instrumentation that we have deployed as part of our Real-Time Monitoring in Boston Harbor project, launched this fall in collaboration with Woods Hole Group and the City of Boston. Collecting high-quality, continuous metocean time series data helps the Lab and municipal partners like the City of Boston evaluate normal, changing climate, and storm conditions in Boston Harbor, which helps inform adaptation and resilience planning.
Please see below for a short summary of data readings and observations.
Observed wave heights at the Boston Harbor Entrance buoy peaked at 6.5 ft. at 2:00pm. Waves rapidly grew in size, increasing from 2 ft. to 6.5 ft. over five hours from approximately 9:00am to 2:00pm, with maximum wave heights coinciding with the hours of high tide. Observed wind speeds at the Boston Harbor entrance buoy reached 36 mph at 11:00am.
This surge referenced above was also observed at our Hohonu overland flood stations throughout Boston (all in inundation depth, in feet above the ground surface).
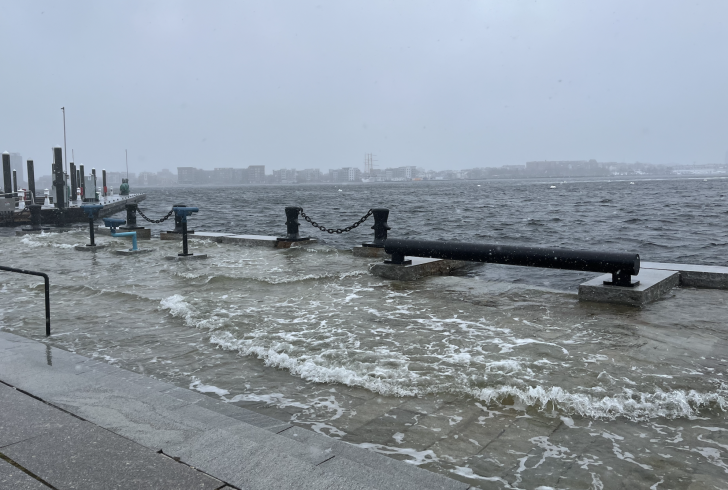
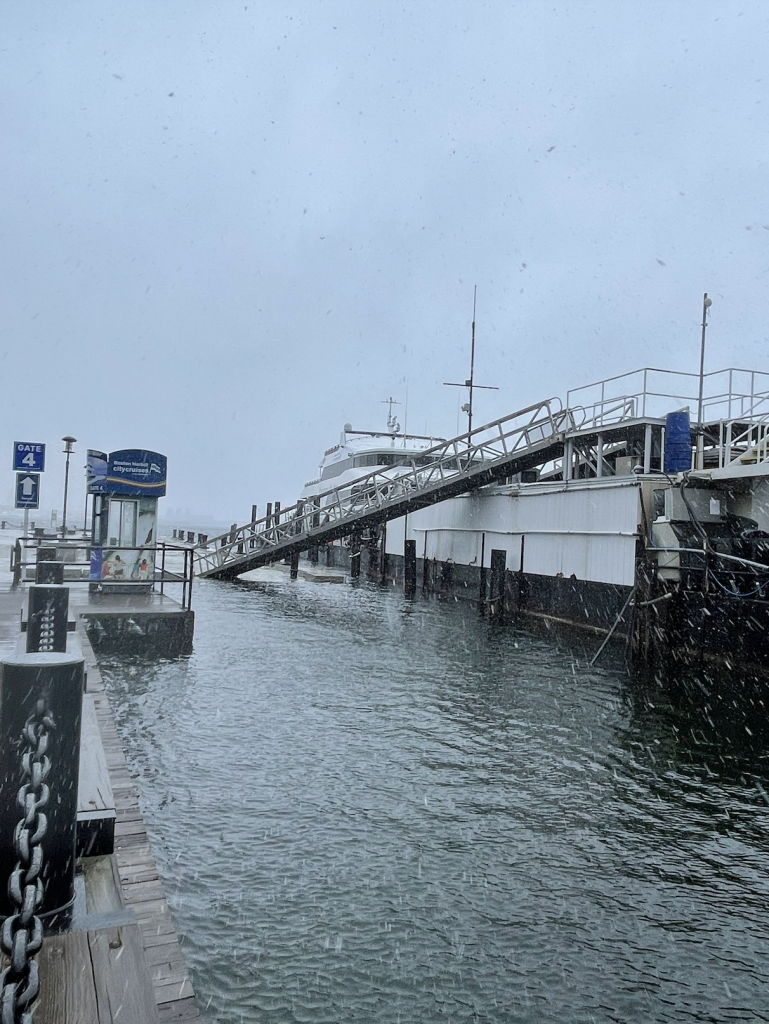
Long Wharf, Downtown Boston: Peak flood depth of 1.5 feet at 1:30pm, with inundation lasting about 2.5 hours from approximately 12:15 – 2:45pm. Prior to February 13, Long Wharf flooded every high tide since Saturday February 10, with the maximum flood depth reaching 1.1 feet at 11:12am that Saturday.
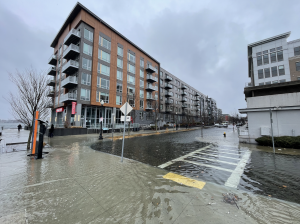
Border Street, East Boston: Peak flood depth of 0.6 feet at 1:30pm, with inundation lasting about 1.5 hours from approximately 1:00 – 2:30pm
Tenean Beach, Dorchester: Peak flood depth of 2.5 ft at 2:12pm, with inundation lasting four hours. The 1:00am high tide on February 13 also resulted in 1.2 ft. of flooding lasting just under five hours. Prior to February 13, the sidewalk at Tenean had flooded every high tide since Friday, February 9, with the maximum flood depth reaching 1.8 ft. at 11:00am on February 10.
Morrissey Boulevard, Dorchester: No flooding was recorded at this station.
Our Rainsford Island station recorded wind speeds of 32 mph with gusts up to 41 mph observed at 1:30pm.
The high tide observed at the Gallops Island tide gauge reached 7.4 ft. NAVD88, in comparison to the 7.8 ft. NAVD88 preliminarily observed at the Boston NOAA station, approximately 2.3 feet higher than the predicted high tide.
This project – launched in the fall of 2023 in partnership with Woods Hole Group and the City of Boston – provides real-time monitoring of waves, water level, and meteorological parameters in and along Boston Harbor. The project is the next phase of work that the Lab has conducted since 2021, and provides a continuous time series of metocean data to evaluate normal conditions, changing climate, and storm conditions in Boston Harbor. All systems are real-time, and as such, will provide preliminary data to the web that can be viewed by the public as well as our researchers.