Field Observations: Real-Time Data from the March 10 Storm & Flooding in Boston
Boston experienced another storm event that caused flooding in several neighborhoods throughout the city on Sunday, March 10, 2024.
Similar to the three significant storms earlier this year (January 10, January 13, and February 13), flooding was recorded at Long Wharf in Downtown Boston, Border Street in East Boston, and Tenean Beach in Dorchester.
Our team at the Stone Living Lab was busy gathering and analyzing data via instrumentation we’ve deployed as part of our Real-Time Monitoring in Boston Harbor project, launched this fall in collaboration with Woods Hole Group and the City of Boston. Collecting high-quality, continuous metocean time series data helps the Lab and municipal partners like the City of Boston evaluate normal, changing climate, and storm conditions in Boston Harbor, which helps inform adaptation and resilience planning.
Please see below for a short summary of data readings and observations.
This surge referenced above was also observed at our Hohonu overland flood stations throughout Boston (all in inundation depth, in feet above the ground surface and peak depth elevations in NAVD88 for reference).
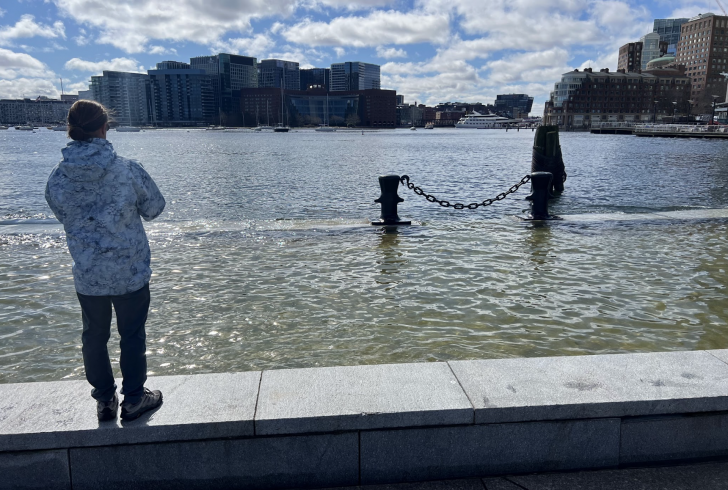
Long Wharf, Downtown Boston: A peak flood depth of 1.5 feet (7.6 ft. NAVD88) was recorded from 11:24am to 12:06pm, with inundation lasting approximately 2.5 hours from 10:24am – 1:00pm. 0.5 feet of flooding was also observed during the second high tide from 11:30pm to 1:06am on Monday 3/11.
Border Street, East Boston: A peak flood depth of 0.7 feet (8.2 ft. NAVD88) was recorded from 11:48am to 12:00pm, with inundation lasting approximately 1.5 hours from 10:54am – 12:30pm.
Tenean Beach, Dorchester: Flooding was observed at the Tenean Beach station each high tide starting on Saturday March 9 at 9:00am:
Morrissey Boulevard, Dorchester: No flooding recorded at the station location.
Data from the Stone Living Lab Rainsford Island Meteorological Station
Our Rainsford Island station recorded the following data between midnight and 12:00pm:
Although the wind had subsided and rotated south-southwest leading up to high tide, our Gallops Island tide gauge recorded a peak of 13.09 ft. (7.59 ft. NAVD88), about a 1.5 feet higher than the predicted 11.49 ft. high tide.
This project – launched in the fall of 2023 in partnership with Woods Hole Group and the City of Boston – provides real-time monitoring of waves, water level, and meteorological parameters in and along Boston Harbor. The project is the next phase of work that the Lab has conducted since 2021, and provides a continuous time series of metocean data to evaluate normal conditions, changing climate, and storm conditions in Boston Harbor. All systems are real-time, and as such, will provide preliminary data to the web that can be viewed by the public as well as our researchers.